If your team still waits hours—or days—for reports, you’re losing time, opportunities, and competitive advantage. A real-time dashboard delivers instant visibility across operations, helping teams act faster, reduce errors, and automate reporting. This article explains how a business intelligence dashboard transforms decision-making through real-time data, automated workflows, and integrated analytics.
The world today functions majorly on data. Organizations are no different. Yet many still rely on slow, manual, end-of-day reporting to understand what happened. By the end of the labor, it may be too late to respond. In a world where operations shift by the minute, waiting for someone to “send the latest report,” creates blind spots that cost revenue and efficiency.
A real-time data dashboard service solves this by giving teams instant, live insights across sales, marketing, finance, operations, and customer experience. Why waste time awaiting updates? Now, the leader in you can make decisions based on what is happening right now.
A real-time data dashboard is a dynamic visualization layer that pulls live data from your tools such as CRM, ERP, Google Analytics, payment gateways, marketing platforms, or custom databases, and then displays them using data visualization components like charts, metrics, alerts, and funnels.
Unlike static reports, a real-time analytics dashboard automatically updates without manual intervention. Teams can monitor trends, detect issues early, and act faster.
Pro Tip: If your reports require exporting spreadsheets or emailing PDFs, you’re operating in “historical mode,” not decision-ready mode.
Modern dashboard software goes above and beyond merely visualizing your data. It automates the entire reporting lifecycle.
No more manual CSV uploads. Dashboards sync with your systems continuously, reducing errors and improving reporting accuracy.
Imagine knowing the moment:
Dashboards can send real-time alerts, enabling teams to intervene before problems escalate.
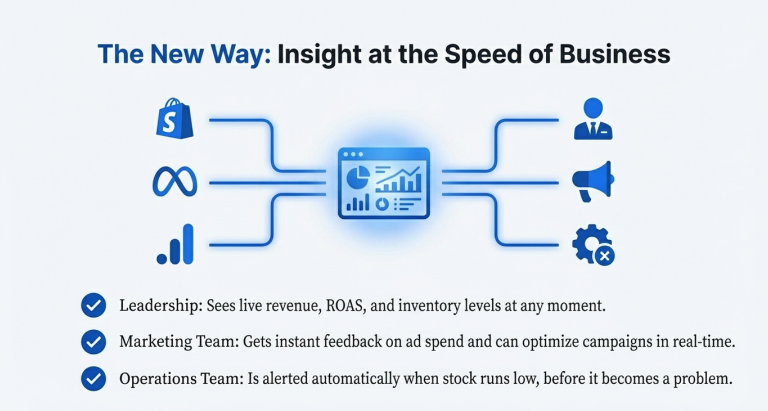
A strong business intelligence dashboard connects CRM, analytics tools, ad platforms, billing systems, and operational software—so teams get a single source of truth.
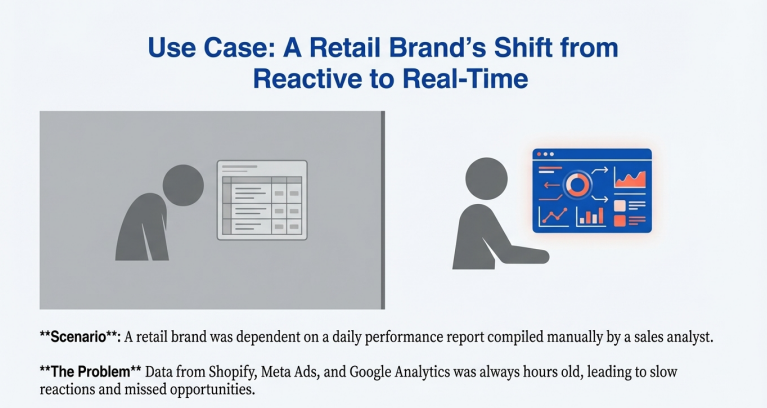
Scenario: A retail brand previously waited each morning for a sales analyst to compile a performance report from Shopify, Meta Ads, and Google Analytics.
With a real-time dashboard service:
Outcome: Faster decisions, fewer errors, and better forecasting accuracy.
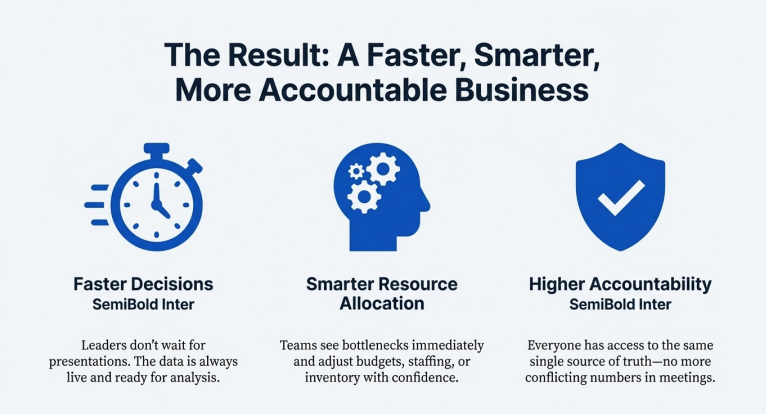
Leaders don’t have to wait for weekly presentations—data is always ready.
Dashboard automation eliminates manual errors introduced through copy-paste workflows.
Teams can see bottlenecks immediately and adjust budgets, staffing, or inventory based on real-time insights.
Everyone has access to the same, real-time truth—no more conflicting numbers.
It eliminates manual data entry and uses automated data syncing, reducing human errors and ensuring your metrics are always current.
Reports show historical snapshots; dashboards show live, interactive, real-time analytics that update automatically.
Yes. Most business intelligence dashboards integrate data from CRMs, analytics tools, ERPs, and marketing platforms.
Track KPIs tied to goals: revenue, conversion rates, customer acquisition cost, inventory levels, operational SLAs, and campaign performance.
Confirm integrations use verified data sources, validate formulas, and ensure refresh cycles align with your operational cadence.